
Learn how to measure student engagement with proven techniques. Discover practical tools and insights to boost learning outcomes today.
Recognizing Real Student Engagement vs. Surface-Level Participation

Let’s be honest, a lot of what we call “student engagement” is just going through the motions. True engagement, the kind that really sparks learning, is something else entirely. Talking with educators who’ve truly nailed this has shown me that genuinely engaged students behave differently, especially when they think nobody’s looking.
The Three Dimensions of Engagement
Real student engagement has three key dimensions: behavioral, emotional, and cognitive. Behavioral engagement is the easiest to see – it’s the outward stuff like joining discussions, finishing assignments, and showing up for class. But it’s just the tip of the iceberg. Attendance is a good starting point, but it’s not the whole picture.
Emotional engagement goes much deeper. It’s about how students feel about learning. Do they feel like they belong? Are they excited by the subject? Do they feel supported? These emotional connections are essential for long-term motivation and success. A student might dutifully attend class and turn in assignments (behavioral engagement) but secretly dread every minute and feel totally disconnected from the material (lack of emotional engagement).
Cognitive engagement is the core of it all. It’s about how students think about their learning. Are they actively wrestling with new ideas? Asking insightful questions? Connecting different concepts? This is where the real learning magic happens. A cognitively engaged student might not be the loudest voice in class, but their mind is buzzing. They’re the ones who hunt down extra resources, relate the material to their own lives, and really consider the implications of what they’re learning.
Why Traditional Metrics Can Be Misleading
Traditional metrics, like attendance and participation points, can give us a false sense of security. They measure surface participation, not true engagement. Picture a student who’s in every class, raises their hand on cue, but is actually daydreaming or scrolling through social media. They’re checking all the “engagement” boxes, but their mind is miles away.
This is why we need to go beyond surface indicators and look at the emotional and cognitive aspects of engagement. In fact, higher education is shifting towards more flexibility and skills-based learning. A recent global survey by Instructure of over 6,100 participants in 17 countries shows growing interest in certificate and apprenticeship programs. This highlights the need to measure engagement in ways that reflect these changing needs. Discover more insights here.
Spotting Real Engagement
So how do we spot real engagement? It takes a more subtle approach. It’s about noticing the small signs that show deep learning is happening. Look for students who actively contribute to discussions, not just repeat facts. Notice who asks thoughtful questions, not just clarifying ones. Pay attention to those who connect the material to their own lives, not just passively absorb information.
You might also be interested in: Check out our guide on increasing website engagement. Recognizing true engagement is a skill that grows over time, but it’s definitely worth developing. It’s the key to unlocking real learning potential. This foundation will change how you think about measuring student engagement and give you clarity on what you’re really trying to track.
Building Your Personal Engagement Measurement System
Forget those overly complicated systems that require a PhD in data science. Let’s build something that actually works for your classroom, something that focuses on the metrics that truly matter in your specific teaching context. It doesn’t matter if you’re teaching elementary school or university courses, the basic principles are the same: tailor your measurement system to your students.
Identifying Key Metrics
Ever wonder how experienced teachers seem to balance those essential gut feelings about student progress with actual hard data? They focus on actionable metrics. These are the measurements that directly inform your teaching strategies, telling you what’s working and what’s not. For example, let’s say you’re noticing consistently low scores on a particular type of problem in your math class. That tells you exactly where you need to adjust your lesson plans-much more effective than just looking at overall grades.
Also, let’s be honest, some metrics create more work than they’re worth. Tracking every single click in your Moodle or Canvas LMS might feel thorough, but are you really getting meaningful insights? Probably not. Instead, focus on metrics that actually align with your learning objectives. If your goal is to build collaborative skills, then track the quality and frequency of student interactions in group projects. Don’t just check a box if they submitted the final product.
Practical Tools and Seamless Integration
The good news is there are tons of practical tools out there that integrate seamlessly into your existing workflow-and many of them are free! Google Forms is a lifesaver for creating quick surveys and quizzes to gauge student understanding and even their emotional state. Plus, your existing learning management system likely has free analytics dashboards to track things like assignment completion rates and time spent on different learning materials.
For video-based learning, tools like VideoQi offer a deeper level of engagement analysis. You can see precisely which parts of a video students rewatch, where they’re clicking on interactive elements, and how they navigate through branching scenarios. This really helps you understand which concepts are resonating and where students might be getting stuck.
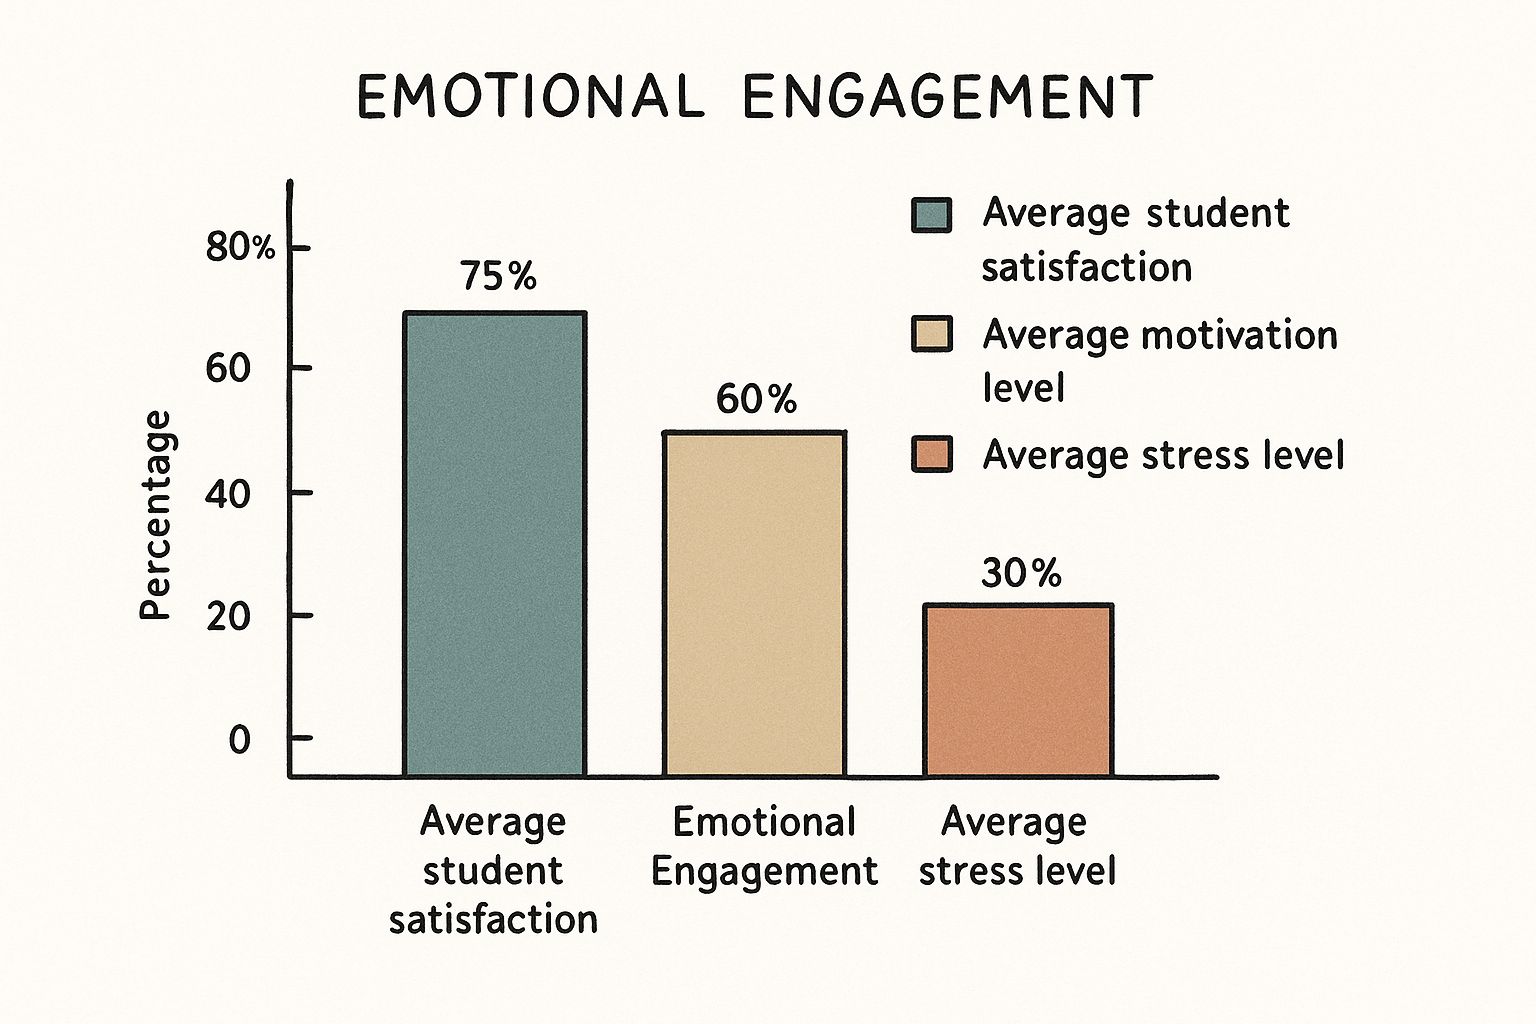
The infographic above visualizes student satisfaction at 75%, motivation at 60%, and stress levels at 30%. Combining these emotional metrics with behavioral data paints a much more complete picture of the learning environment. While satisfaction and motivation seem pretty good, that lower stress level might suggest the learning experience isn’t challenging enough.
Let’s look at a comparison of some traditional and modern approaches to measuring engagement. This table helps illustrate how you can move beyond basic metrics and really understand what’s happening in your classroom:
| Traditional Metric | Modern Alternative | Why It Matters | Ease of Implementation |
|---|---|---|---|
| Course Completion Rate | Learning Objective Mastery | Focuses on actual learning outcomes, not just attendance | Medium (requires clear learning objectives) |
| Time Spent on Platform | Time Spent Actively Engaged (e.g., contributing to discussions, completing interactive exercises) | Distinguishes between passive presence and active participation | Medium (requires tracking specific actions) |
| Test Scores | Qualitative Feedback (e.g., student reflections, peer reviews) | Provides richer insights into student understanding and areas for improvement | Medium (requires designing effective feedback mechanisms) |
| Attendance | Participation in Collaborative Activities | Measures engagement with the learning community, not just physical presence | Medium (requires structuring collaborative opportunities) |
This table highlights how shifting your focus from traditional metrics to more modern, nuanced approaches can give you a more accurate picture of student engagement and its impact on learning.
Establishing Baselines and Realistic Routines
Before making any changes, establish your baseline. This simply means taking an initial measurement to give you a reference point for future comparison. It’s like calibrating an instrument. For instance, if you’re planning to introduce a new collaborative learning activity, measure current student interaction patterns before implementing it. This allows you to assess how the new activity actually shifts those patterns.
Speaking of measurement, let’s talk about keeping it realistic. You don’t want to bury yourself (or your students) in data. Find a sustainable rhythm for data collection that doesn’t disrupt the flow of learning. Maybe it’s a short weekly check-in survey, combined with some informal observations during class. The key is to build a routine that feels natural, not like an extra chore.
Getting Student Buy-In
Finally, what about those students who might be a little skeptical of all this measurement? Transparency is key. Clearly explain why you’re measuring engagement and how the data will be used. Emphasize that it’s all about improving their learning experience, not evaluating or judging them. Even better, involve them in the process! Ask what they think is important to measure and how they prefer to give feedback. This not only gets them on board but also gives you valuable insight into what matters most to them.
Harnessing AI and Technology for Deeper Learning Insights

This screenshot from Number Analytics, a platform using AI for educational insights, really highlights something important. Notice how clean the dashboard design is? That emphasis on data visualization makes key metrics pop, making it easier to understand what’s going on. It reminds us that data is only powerful if you can actually use it. It’s about telling a story, not just crunching numbers.
Remember the days when tracking student engagement meant taking attendance and maybe glancing over some test scores? Things have changed. Now we have tools powered by AI that can track the tiny details – the micro-behaviors – revealing hidden patterns in how students actually learn. This lets us pinpoint exactly where students shine and where they struggle, so we can provide the kind of personalized support that truly makes a difference.
AI-Enhanced Learning Tools: A Real Game Changer for Measurement
AI-powered platforms, like adaptive learning systems, give us a level of detail that was just impossible with old-school methods. These systems track how students interact with the material, tweaking the difficulty and providing personalized feedback in real-time. It’s like having a personal tutor for each student, constantly adapting to their individual needs. And this personalized approach isn’t just about efficiency, it’s about creating a more engaging and effective learning experience.
Let’s say a student is hitting a roadblock with a particular math concept. An AI-powered system can pick up on this struggle based on their answers and automatically provide targeted practice problems and explanations specifically addressing their difficulty. This immediate feedback and personalized support can be incredibly motivating and keep students engaged. For more on how interactive video can ramp up engagement, you might find this interesting: Learn more about interactive video software.
Video Analytics: Unlocking Engagement in Digital Learning
Video is everywhere in education these days. But how can you tell if students are really absorbing the content? That’s where video analytics come in. Platforms like VideoQi let educators track viewer behavior, showing which parts of a video are being rewatched, where students click on interactive elements, and how they navigate through branching scenarios. This granular detail helps you understand what’s clicking with students and where they might be getting tripped up.
Student engagement is a big deal globally. The rise of AI-enhanced learning tools offers a real reason for optimism. Studies show a 67% increase in student engagement metrics in classrooms using AI compared to those using traditional methods. This boost is especially noticeable in STEM subjects, where interactive AI simulations and adaptive problem sets provide personalized challenges and instant feedback. This points to AI’s potential to improve educational equity, particularly in schools that have historically faced challenges. For a deeper dive into these stats, check out this link: Discover more insights here.
LMS Data and Mobile Apps: Capturing Real-Time Engagement Signals
Learning management systems (LMS) are treasure troves of engagement data. They track things like assignment completion rates, time spent on different activities, and participation in online discussions. And mobile apps open up opportunities for real-time feedback and interaction, providing invaluable insights into student understanding and motivation. By pulling together data from these different sources, educators can get a really complete view of student engagement.
The key to using these tools effectively is being thoughtful. Choose technologies that actually align with your teaching goals and your students’ needs. This isn’t about surveillance; it’s about using data wisely to understand how your students learn best and to design more engaging and effective learning experiences. This approach helps educators go beyond superficial participation and get to the heart of what drives deep learning.
Mastering the Art of Student Feedback Collection

Surveys can be amazing for gauging student engagement. But let’s be honest, sometimes they feel like a chore, both for the students filling them out and for us trying to decipher the results. The trick is to make them engaging and insightful. Let’s explore how to create feedback mechanisms that students actually want to use and give you information you can actually do something with. For even more insights into tech and education, check out these AI tools for education.
Crafting Engaging Questions: The Psychology of Feedback
Think about surveys you’ve personally taken. How many times have you just breezed through, clicking 1 to 5 without much thought? Generic rating scales rarely capture the true story. Instead, try sprinkling in open-ended questions. These encourage students to express themselves in their own words, giving you a much richer understanding of their experiences.
For example, instead of “How satisfied are you with this course?”, try something like “What’s one thing you’ve learned that surprised you?” or “What could make this course even better?”.
Combining quantitative scales with qualitative feedback provides a more well-rounded perspective. You see the overall satisfaction rating and understand the “why” behind it.
Timing is Everything: Maximizing Response Rates and Quality
When you send a survey matters just as much as what you ask. A survey sent the day before finals? Good luck getting thoughtful responses! Try sending surveys at natural breaks in the learning process, like after a big project or unit. This gives students time to reflect and provide more meaningful input.
Another tip? Integrate surveys into existing touchpoints, like quick polls at the end of class or feedback prompts within your learning management system (LMS). This makes feedback feel less like an extra task and more like a natural part of the learning experience. This also helps combat survey fatigue! Speaking of measuring engagement, consistent surveys combined with data from benchmarks like the National Survey of Student Engagement (NSSE) can offer valuable long-term insights. Check out this resource on how to measure student engagement for a deeper dive.
Turning Data Into Action: Concrete Improvements Students Will Notice
Collecting feedback is only half the battle. The real magic happens when you use it. Don’t let it gather dust in a forgotten folder. Share key findings with your students and explain how their feedback is shaping the learning experience. This builds trust and shows them their voices are heard.
For instance, if students consistently mention feeling overwhelmed by the workload, explore breaking assignments into smaller chunks or adjusting the course pace. If they’re confused about a particular concept, revisit it in class or provide supplemental resources.
By showing you’re listening and taking action, you cultivate a culture of continuous improvement. Students become more invested in the learning process, not just the content, because they see their feedback making a real difference. This creates a powerful cycle: feedback fuels improvement, which fuels engagement.
Decoding Behavioral Data and Learning Analytics
Numbers tell a story. But data without context is just noise. You need the right lens to understand what all those numbers really mean for your students. Let’s ditch the surface-level metrics and dive into the behavioral signals that reveal genuine engagement.
Unpacking the Behavioral Signals of Engagement
Behavioral data is basically a record of what students do in your digital learning environment. Think of it like digital footprints. How long do they spend on a task? What’s their click pattern within the learning platform? How often do they contribute to discussions? Even their video viewing habits can be incredibly insightful.
For example, I once noticed a bunch of my students kept re-watching the same 2-minute section of a video lecture. That told me they were probably struggling with that specific concept. I revisited the topic in the next class, and it made a world of difference.
Assignment completion rates are another classic metric. But don’t just look at the raw completion percentage. Are assignments submitted on time? Are students using feedback to revise their work? The how and when can reveal as much about engagement as the whether.
Advanced Analytics: Predicting Disengagement Before It Happens
Basic behavioral indicators are a great starting point. But advanced analytics can take your understanding to the next level. Learning path analysis, for example, shows you the routes students take through your materials. Are they skipping modules? Revisiting certain concepts over and over? These patterns can uncover hidden roadblocks or spark ideas for personalized learning plans.
Predictive modeling is another game-changer. Using historical data, you can actually forecast future student behavior. It’s like a weather forecast for engagement! By spotting patterns that typically precede disengagement, you can proactively support students before they fall behind. If you’re keen to explore video engagement in more detail, check out this guide on video engagement metrics.
Using Data to Understand How Students Actually Learn
Data-savvy educators are already using these tools to gain valuable insights. Think about heat maps, which visually show where students are clicking most on a webpage. This reveals what content is grabbing their attention (and what’s being ignored). Click-stream data takes it a step further, tracking the sequence of clicks to understand how students navigate your materials. Do they jump around randomly or follow a logical progression? Tools like those that let you easily Create A New Survey can help you gather targeted feedback and close the loop.
To help you translate data into action, I’ve put together a handy table summarizing some key behavioral indicators:
Here’s a quick breakdown of some key behavioral indicators and how you can interpret them. This table offers clear interpretations and suggests actions you can take when you see certain patterns.
| Behavioral Indicator | High Engagement Signal | Warning Signs | Recommended Action |
|---|---|---|---|
| Time-on-Task | Consistent, focused time spent on challenging activities | Short bursts of activity followed by long periods of inactivity | Break down complex tasks into smaller, manageable chunks. Provide regular check-in points. |
| Interaction Patterns | Frequent, thoughtful contributions to discussions; active exploration of learning materials | Limited participation in discussions; passive consumption of content | Design more interactive activities. Personalize learning paths based on individual interests. |
| Assignment Completion Rates | Consistent submission of high-quality work; utilization of feedback for improvement | Late or missing assignments; lack of effort in revisions | Provide clear expectations and deadlines. Offer individualized support and feedback. |
| Discussion Quality | Thoughtful questions and insightful comments; respectful engagement with peers | Superficial or off-topic comments; lack of engagement with other students’ ideas | Facilitate structured discussions with clear guidelines. Model respectful communication. |
By understanding these signals, you can move beyond simply measuring engagement and start understanding how your students learn best. This knowledge is incredibly powerful. It allows you to create more effective teaching strategies that truly resonate with your students and improve learning outcomes.
Creating Dashboards That Drive Action, Not Confusion
Data without action? It’s just noise. Turning engagement metrics into useful dashboards is the key. These dashboards should inspire improvement, not give you a headache. When you’re looking at behavioral data, a well-designed HR analytics dashboard is essential for understanding what it all means. Let’s talk about how effective educators create visual summaries that highlight the most important insights.
Visualizing Engagement Data: Telling the Story, Not Just Showing the Numbers
Good dashboards don’t just throw charts and graphs at you. They use smart visuals that make complex engagement data easy to understand for everyone – administrators, teachers, and even students. Imagine a dashboard that uses color-coded progress bars to show student progress on learning goals. Boom! You instantly see who’s doing well and who needs a little extra help.
Interactive charts are another game-changer. Click on a data point, and you dive deeper into the details. It’s like being a detective, uncovering the “why” behind the numbers instead of just seeing the surface.
Prioritizing Metrics: Daily Glances vs. Deep Dives
Let’s be real, not all metrics are created equal. Some, like daily homework completion rates, just need a quick check. Others, like student feedback on a big project, need a more thorough review. Your dashboard should reflect this.
Think of your car’s dashboard. You’re always watching your speed and gas level, but you only check the oil occasionally. Your engagement dashboard should work the same way – showing you the critical real-time info while giving you access to deeper data when you need it. This helps you avoid information overload and lets you focus on what matters most right now.
Presenting Findings: Driving Action, Not Just Checking Boxes
Measuring student engagement is about boosting learning, not just filling out reports. Your dashboards should make this clear. Instead of just showing raw numbers, turn them into actionable advice.
For example, if your data shows low engagement during online discussions, suggest some ways to make them more interesting. Maybe add polls, debates, or small group activities. This turns data from a passive report into an active tool for improvement.
Sharing Data Effectively: Tailoring the Message to the Audience
How you share data depends on who you’re talking to. Administrators might want to see big-picture trends, while your fellow teachers are probably more interested in classroom-specific info. Students, of course, care most about their own progress. Tailor your presentations accordingly.
Sharing dashboards directly with students can be really powerful. It gives them a sense of ownership over their learning and helps them see how their actions impact their progress. This kind of transparency builds a data-driven learning culture. Remember, the point isn’t just to collect data, but to use it to make learning better for everyone.
Transforming Insights Into Real Learning Improvements
Measurement without action is like a compass without a map. It tells you where you are but doesn’t help you get where you need to go. This section is all about bridging that gap-using your engagement insights to actually improve the learning experience. Think of your data as a roadmap, guiding you towards better student success.
Prioritizing Improvements Based On Data
Effective educators don’t just gather data; they use it to make smart decisions. Let’s say you find low engagement during online discussions. Don’t panic! Experiment! Try different formats. Maybe polls, debates, or even small group activities will reignite the conversation. Treat it like an experiment-testing what resonates with your students.
What if your VideoQi analytics show students repeatedly re-watching a specific part of a video? That’s a huge clue! It probably means they’re struggling with that concept. Revisiting it in class or providing extra resources could make all the difference.
Testing Interventions Systematically
When you make a change based on data, don’t just assume it’s working. Test it! Like scientists running controlled experiments, you should systematically measure the impact of any changes. This might mean comparing engagement levels before and after a new strategy.
Say you introduce a new collaborative learning activity. Track student interaction before and after. This gives you solid evidence of its effect. If it’s not working, tweak it or try something different. This back-and-forth process is crucial for constant improvement.
Creating Feedback Loops For Continuous Refinement
Teaching is an ever-evolving process. Engagement data lets you fine-tune your approach over time, creating a cycle of improvement. Regular student feedback, alongside other engagement metrics, informs your teaching strategies, impacting student engagement. It’s a dynamic feedback loop that keeps you moving forward.
Case Studies: Real-World Examples Of Engagement Improvements
Let’s get practical. One educator noticed low engagement during online discussions. By incorporating interactive elements like polls and debates, she saw participation (and the quality of contributions) skyrocket. Another teacher used video analytics to pinpoint confusing concepts and provide targeted support. This led to better performance on assessments.
These success stories showcase the impact of data-driven decisions. They show how measuring and acting on engagement can truly transform the learning experience.
Avoiding Pitfalls And Maintaining Focus
Don’t get bogged down in data overload. Focus on the metrics that matter most to your goals and student needs. Another common trap is assuming a strategy that worked for someone else will automatically work for you. Test and refine based on your specific data.
Ready to take your video learning up a notch? VideoQi provides a powerful platform for interactive and engaging video experiences that boost learning outcomes. Transform your video learning with VideoQi today!


